
Blankenbach thermal-convection benchmark
This two-dimensional model reproduces the thermal-convection benchmark of Blankenbach et al. (1989). It couples Stokes flow, pseudo-transient thermal diffusion, and particle-based subgrid diffusion to follow a temperature anomaly in a viscous mantle.
Run the miniapp from the repository root with
julia --project=miniapps --startup-file=no miniapps/benchmarks/stokes2D/Blankenbach2D/Benchmark2D_sgd.jlImports and backends
const isCUDA = falseconst isCUDA = true
@static if isCUDA
    using CUDA
end

using JustRelax, JustRelax.JustRelax2D, JustRelax.DataIO
using Pkg; Pkg.activate("miniapps")

const backend = @static if isCUDA
    JustRelax.CUDABackend # Options: CPUBackend, CUDABackend, AMDGPUBackend
else
    JustRelax.CPUBackend # Options: CPUBackend, CUDABackend, AMDGPUBackend
end

using ParallelStencil, ParallelStencil.FiniteDifferences2D

@static if isCUDA
    @init_parallel_stencil(CUDA, Float64, 2)
else
    @init_parallel_stencil(Threads, Float64, 2)
end

using JustPIC
const backend_JP = @static if isCUDA
    CUDA.CUDABackend # Options: JustPIC.CPU, CUDA.CUDABackend, AMDGPU.ROCBackend
else
    JustPIC.CPU # Options: JustPIC.CPU, CUDA.CUDABackend, AMDGPU.ROCBackend
end
Load script dependencies
using Printf, LinearAlgebra, GeoParams, CairoMakieThe material parameters are defined in Blankenbach_Rheology.jl.
include(joinpath(@__DIR__, "Blankenbach_Rheology.jl"))Helper functions
Copy the interior x values of an array into a halo field.
function copyinn_x!(A, B)

    @parallel function f_x(A, B)
        @all(A) = @inn_x(B)
        return nothing
    end

    return @parallel f_x(A, B)
end
Initialize the conductive thermal profile between the 273 K surface and the 1273 K basal temperature.
@parallel_indices (i, j) function init_T!(T, y)
    depth = -y[j]

    dTdZ = (1273 - 273) / 1000.0e3
    offset = 273.0e0
    T[i + 1, j + 1] = (depth) * dTdZ + offset
    return nothing
end
Add the rectangular thermal perturbation that drives the convection.
function rectangular_perturbation!(T, xc, yc, r, xvi)
    @parallel_indices (i, j) function _rectangular_perturbation!(T, xc, yc, r, x, y)
        if ((x[i] - xc)^2 ≤ r^2) && ((y[j] - yc)^2 ≤ r^2)
            T[i + 1, j + 1] += 20.0
        end
        return nothing
    end
    ni = size(T) .- 2
    @parallel (@idx ni) _rectangular_perturbation!(T, xc, yc, r, xvi...)
    return nothing
end
Model setup and solution
function main2D(igg; ar = 1, nx = 32, ny = 32, nit = 1.0e1, figdir = "figs2D", do_vtk = false, finalize_MPI = true)Model domain
The domain is 1000 km high and has aspect ratio ar. Geometry provides the staggered cell-center and vertex coordinates.
    ly = 1000.0e3               # domain length in y
    lx = ly                   # domain length in x
    ni = nx, ny               # number of cells
    li = lx, ly               # domain length in x- and y-
    di = @. li / ni           # grid step in x- and -y
    origin = 0.0, -ly             # origin coordinates
    grid = Geometry(ni, li; origin = origin)
    (; xci, xvi) = grid # nodes at the center and vertices of the cells
Material properties
The benchmark uses the single-phase material configuration from Blankenbach_Rheology.jl. Its thermal diffusivity sets the diffusive time-step limit.
    rheology = init_rheologies()
    κ = (rheology[1].Conductivity[1].k / (rheology[1].HeatCapacity[1].Cp * rheology[1].Density[1].ρ0))
    dt = dt_diff = 0.9 * min(di...)^2 / κ / 4.0 # diffusive CFL timestep limiter
Particles and phase ratios
Particles carry temperature and phase information. SubgridDiffusionCellArrays supplies the particle-scale diffusion state, and PhaseRatios transfers particle phases to the staggered grid.
    nxcell, max_xcell, min_xcell = 24, 36, 12
    particles = init_particles(
        backend_JP, nxcell, max_xcell, min_xcell, grid.xi_vel...
    )
    subgrid_arrays = SubgridDiffusionCellArrays(particles; loc = :center)
temperature
    pT, pT0, pPhases = init_cell_arrays(particles, Val(3))
    particle_args = (pT, pT0, pPhases)
    phase_ratios = PhaseRatios(backend_JP, length(rheology), ni)
    init_phases!(pPhases, particles)
    update_phase_ratios!(phase_ratios, particles, pPhases)
Stokes and thermal state
Allocate the Stokes and thermal fields together with their pseudo-transient coefficients.
    stokes = StokesArrays(backend, ni)
pt_stokes = PTStokesCoeffs(li, di; ϵ_abs = 1.0e-4, ϵ_rel = 1.0e-4, CFL = 1 / √2.1) thermal = ThermalArrays(backend, ni)Initialize the conductive profile and impose fixed temperatures at the top and bottom, with insulating sidewalls.
    @parallel (@idx ni) init_T!(thermal.T, xci[2])
    Ttop = thermal.T[1, end]
    Tbot = thermal.T[1, 1]
    thermal_bc = TemperatureBoundaryConditions(;
        no_flux = (left = true, right = true, top = false, bot = false),
        constant_value = (left = false, right = false, top = Ttop, bot = Tbot),
    )
The perturbation is centered at 600 km depth and spans 200 km in each direction despite the helper's historical rectangular name.
    xc_anomaly = 0.0    # origin of thermal anomaly
    yc_anomaly = -600.0e3  # origin of thermal anomaly
    r_anomaly = 100.0e3    # radius of perturbation
    rectangular_perturbation!(thermal.T, xc_anomaly, yc_anomaly, r_anomaly, xci)
    thermal_bcs!(thermal, thermal_bc)
    thermal.Told .= thermal.T
The printed Rayleigh number characterizes the relative importance of buoyancy and viscous resistance for this setup.
    ΔT = thermal.T[1, 1] - thermal.T[1, end]
    Ra = (rheology[1].Density[1].ρ0 * rheology[1].Gravity[1].g * rheology[1].Density[1].α * ΔT * ly^3.0) /
        (κ * rheology[1].CompositeRheology[1].elements[1].η)
    @show Ra

    args = (; T = thermal.T, P = stokes.P, dt = Inf)
Initialize buoyancy and viscosity from the thermal field.
    ρg = @zeros(ni...), @zeros(ni...)
    η = @ones(ni...)
    compute_ρg!(ρg[2], phase_ratios, rheology, args)
    compute_viscosity!(
        stokes, phase_ratios, args, rheology, (-Inf, Inf)
    )
Allocate pseudo-transient coefficients for thermal diffusion.
    pt_thermal = PTThermalCoeffs(
        backend, rheology, phase_ratios, args, dt, ni, di, li; ϵ = 1.0e-5, CFL = 0.5 / √2.1
    )
Use free-slip velocity boundaries and synchronize the velocity halos.
    flow_bcs = VelocityBoundaryConditions(;
        free_slip = (left = true, right = true, top = true, bot = true),
    )
    flow_bcs!(stokes, flow_bcs) # apply boundary conditions
    update_halo!(@velocity(stokes)...)
Output
Create the figure directory and, optionally, a VTK directory for ParaView output.
    if do_vtk
        vtk_dir = joinpath(figdir, "vtk")
        take(vtk_dir)
    end
    take(figdir)
Plot the initial temperature and viscosity depth profiles.
    fig = let
        Yv = [y for x in xvi[1], y in xvi[2]][:]
        Y = [y for x in xci[1], y in xci[2]][:]
        fig = Figure(size = (1200, 900))
        ax1 = Axis(fig[1, 1], aspect = 2 / 3, title = "T")
        ax2 = Axis(fig[1, 2], aspect = 2 / 3, title = "log10(η)")
        scatter!(ax1, Array(thermal.T[2:(end - 1), 2:(end - 1)][:]), Y ./ 1.0e3)
        scatter!(ax2, Array(log10.(η[:])), Y ./ 1.0e3)
        ylims!(ax1, minimum(xvi[2]) ./ 1.0e3, 0)
        ylims!(ax2, minimum(xvi[2]) ./ 1.0e3, 0)
        hideydecorations!(ax2)
        save(joinpath(figdir, "initial_profile.png"), fig)
        fig
    end

    centroid2particle!(pT, thermal.T, particles)
    pT0.data .= pT.data

    local Vx_v, Vy_v
    if do_vtk
        Vx_v = @zeros(ni .+ 1...)
        Vy_v = @zeros(ni .+ 1...)
    end
Advancing one time step
Each iteration updates buoyancy and viscosity, solves Stokes, advances thermal and subgrid diffusion, advects particles, and records the Nusselt number and root-mean-square velocity.
    t, it = 0.0, 1
    Urms = Float64[]
    Nu_top = Float64[]
    trms = Float64[]
Buffer arrays to compute velocity rms
    Vx_v = @zeros(ni .+ 1...)
    Vy_v = @zeros(ni .+ 1...)

    dt₀ = similar(thermal.T)

    while it ≤ nit
@show it- Update buoyancy and viscosity.
        args = (; T = thermal.T, P = stokes.P, dt = Inf)
        compute_viscosity!(stokes, phase_ratios, args, rheology, (-Inf, Inf))
compute_ρg!(ρg[2], phase_ratios, rheology, args)- Solve Stokes and select an adaptive time step.
        solve!(
            stokes,
            pt_stokes,
            grid,
            flow_bcs,
            ρg,
            phase_ratios,
            rheology,
            args,
            Inf,
            igg;
            kwargs = (;
                iterMax = 150.0e3,
                nout = 200,
                viscosity_cutoff = (-Inf, Inf),
                verbose = true,
            )
        )
dt = compute_dt(stokes, di, dt_diff)- Advance grid- and particle-scale thermal diffusion.
        heatdiffusion_PT!(
            thermal,
            pt_thermal,
            thermal_bc,
            rheology,
            args,
            dt,
            grid;
            kwargs = (;
                igg = igg,
                phase = phase_ratios,
                iterMax = 10.0e3,
                nout = 1.0e2,
                verbose = true,
            )
        )
        subgrid_characteristic_time!(
            subgrid_arrays, particles, dt₀, phase_ratios, rheology, thermal, stokes
        )
        @views dt₀[1, :] .= dt₀[2, :]
        @views dt₀[end, :] .= dt₀[end - 1, :]
        @views dt₀[:, 1] .= dt₀[:, 2]
        @views dt₀[:, end] .= dt₀[:, end - 1]
        centroid2particle!(subgrid_arrays.dt₀, dt₀, particles)
        subgrid_diffusion_centroid!(
            pT, thermal.T, thermal.ΔT, subgrid_arrays, particles, dt
)- Advect particles and update the phase ratios.
advection!(particles, RungeKutta2(), @velocity(stokes), dt)advect particles in memory
move_particles!(particles, particle_args)check if we need to inject particles
inject_particles_phase!(particles, pPhases, (pT,), (thermal.T,))update phase ratios
update_phase_ratios!(phase_ratios, particles, pPhases)- Record the Nusselt number and root-mean-square velocity.
        Nu_it = (ly / (1000.0 * lx)) *
            sum(((abs.(thermal.T[2:(end - 1), end] - thermal.T[2:(end - 1), end - 1])) ./ di[2]) .* di[1])
        push!(Nu_top, Nu_it)
Compute the dimensionless root-mean-square velocity:
$
U_{\mathrm{rms}} = \frac{H \rho_0 c_p}{k} \sqrt{\frac{1}{LH} \int_\Omega (v_x^2 + v_y^2),\mathrm{d}\Omega}. $
        Urms_it = let
            velocity2vertex!(Vx_v, Vy_v, stokes.V.Vx, stokes.V.Vy)
            @. Vx_v .= hypot.(Vx_v, Vy_v) # we reuse Vx_v to store the velocity magnitude
            sqrt(sum(Vx_v .^ 2 .* prod(di)) / lx / ly) *
                ((ly * rheology[1].Density[1].ρ0 * rheology[1].HeatCapacity[1].Cp) / rheology[1].Conductivity[1].k)
        end
        push!(Urms, Urms_it)
push!(trms, t)- Interpolate particle temperature back to the thermal grid.
        particle2centroid!(thermal.T, pT, particles)
flow_bcs!(stokes, flow_bcs) # apply boundary conditions- Write snapshots and time-series figures at the requested interval.
        if it == 1 || rem(it, 200) == 0 || it == nit

            if do_vtk
                velocity2vertex!(Vx_v, Vy_v, @velocity(stokes)...)
                data_v = (;
                    τxy = Array(stokes.τ.xy),
                    εxy = Array(stokes.ε.xy),
                    Vx = Array(Vx_v),
                    Vy = Array(Vy_v),
                )
                data_c = (;
                    P = Array(stokes.P),
                    T = Array(thermal.T[2:(end - 1), 2:(end - 1)]),
                    τxx = Array(stokes.τ.xx),
                    τyy = Array(stokes.τ.yy),
                    εxx = Array(stokes.ε.xx),
                    εyy = Array(stokes.ε.yy),
                    η = Array(stokes.viscosity.η),
                )
                velocity_v = (
                    Array(Vx_v),
                    Array(Vy_v),
                )
                save_vtk(
                    joinpath(vtk_dir, "vtk_" * lpad("$it", 6, "0")),
                    xvi,
                    xci,
                    data_v,
                    data_c,
                    velocity_v,
                    t = t
                )
            end
Make particles plottable
            p = particles.coords
            ppx, ppy = p
            pxv = ppx.data[:] ./ 1.0e3
            pyv = ppy.data[:] ./ 1.0e3
            clr = pT.data[:] #pPhases.data[:]
            idxv = particles.index.data[:]
Make Makie figure
            fig = Figure(size = (900, 900), title = "t = $t")
            ax1 = Axis(fig[1, 1], aspect = ar, title = "T [K]  (t=$(t / (1.0e6 * 3600 * 24 * 365.25)) Myrs)")
            ax2 = Axis(fig[2, 1], aspect = ar, title = "Vy [m/s]")
            ax3 = Axis(fig[1, 3], aspect = ar, title = "Vx [m/s]")
ax4 = Axis(fig[2, 3], aspect = ar, title = "T [K]") h1 = heatmap!(ax1, xci[1] .* 1.0e-3, xci[2] .* 1.0e-3, Array(thermal.T[2:(end - 1), 2:(end - 1)]), colormap = :lajolla, colorrange = (273, 1273)) h2 = heatmap!(ax2, xvi[1] .* 1.0e-3, xvi[2] .* 1.0e-3, Array(stokes.V.Vy), colormap = :batlow) h3 = heatmap!(ax3, xvi[1] .* 1.0e-3, xvi[2] .* 1.0e-3, Array(stokes.V.Vx), colormap = :batlow) h4 = scatter!(ax4, Array(pxv[idxv]), Array(pyv[idxv]), color = Array(clr[idxv]), colormap = :lajolla, colorrange = (273, 1273), markersize = 3)
#h4 = heatmap!(ax4, xci[1].*1e-3, xci[2].*1e-3, Array(log10.(η)) , colormap=:batlow)
hidexdecorations!(ax1)
hidexdecorations!(ax2)
hidexdecorations!(ax3)
Colorbar(fig[1, 2], h1)
Colorbar(fig[2, 2], h2)
Colorbar(fig[1, 4], h3)
Colorbar(fig[2, 4], h4)
linkaxes!(ax1, ax2, ax3, ax4)
save(joinpath(figdir, "$(it).png"), fig)
fig
fig2 = Figure(size = (900, 1200), title = "Time Series")
ax21 = Axis(fig2[1, 1], aspect = 3, title = L"V_{RMS}")
ax22 = Axis(fig2[2, 1], aspect = 3, title = L"Nu_{top}")
l1 = lines!(ax21, trms ./ (1.0e6 * (365.25 * 24 * 60 * 60)), Urms)
l2 = lines!(ax22, trms ./ (1.0e6 * (365.25 * 24 * 60 * 60)), Nu_top)
save(joinpath(figdir, "Time_Series_V_Nu.png"), fig2)
end
it += 1
t += dt endPlot horizontally averaged temperature and viscosity profiles.
    Tmean = @zeros(ny + 1)
    Emean = @zeros(ny)

    let
        for j in 1:(ny + 1)
            Tmean[j] = sum(thermal.T[2:(end - 1), j]) / (nx + 1)
        end
        for j in 1:ny
            Emean[j] = sum(η[:, j]) / nx
        end
        Y = [y for x in xci[1], y in xci[2]][:]
        fig = Figure(size = (1200, 900))
        ax1 = Axis(fig[1, 1], aspect = 2 / 3, title = "⟨T⟩")
        ax2 = Axis(fig[1, 2], aspect = 2 / 3, title = "⟨log10(η)⟩")
        lines!(ax1, Tmean, xvi[2] ./ 1.0e3)
        lines!(ax2, log10.(Emean), xci[2] ./ 1.0e3)
        ylims!(ax1, minimum(xvi[2]) ./ 1.0e3, 0)
        ylims!(ax2, minimum(xvi[2]) ./ 1.0e3, 0)
        hideydecorations!(ax2)
        save(joinpath(figdir, "Mean_profiles_$(it).png"), fig)
        fig
    end

    @show Urms[Int64(nit)] Nu_top[Int64(nit)]

    finalize_global_grid(; finalize_MPI = finalize_MPI)

    return Urms, Nu_top, trms, thermal.T, xvi
end
Run configuration
Configure the output directory, optional VTK output, domain aspect ratio, resolution, and number of time steps for a standalone benchmark run.
figdir = "Blankenbach_subgrid"
do_vtk = false # set to true to generate VTK files for ParaView
ar = 1 # aspect ratio
n = 64
nx = n
ny = n
nit = 6.0e3
igg = if !(JustRelax.MPI.Initialized()) # initialize (or not) MPI grid
    IGG(init_global_grid(nx, ny, 1; init_MPI = true)...)
else
    igg
end

main2D(igg; figdir = figdir, ar = ar, nx = nx, ny = ny, nit = nit, do_vtk = do_vtk);
Reference results
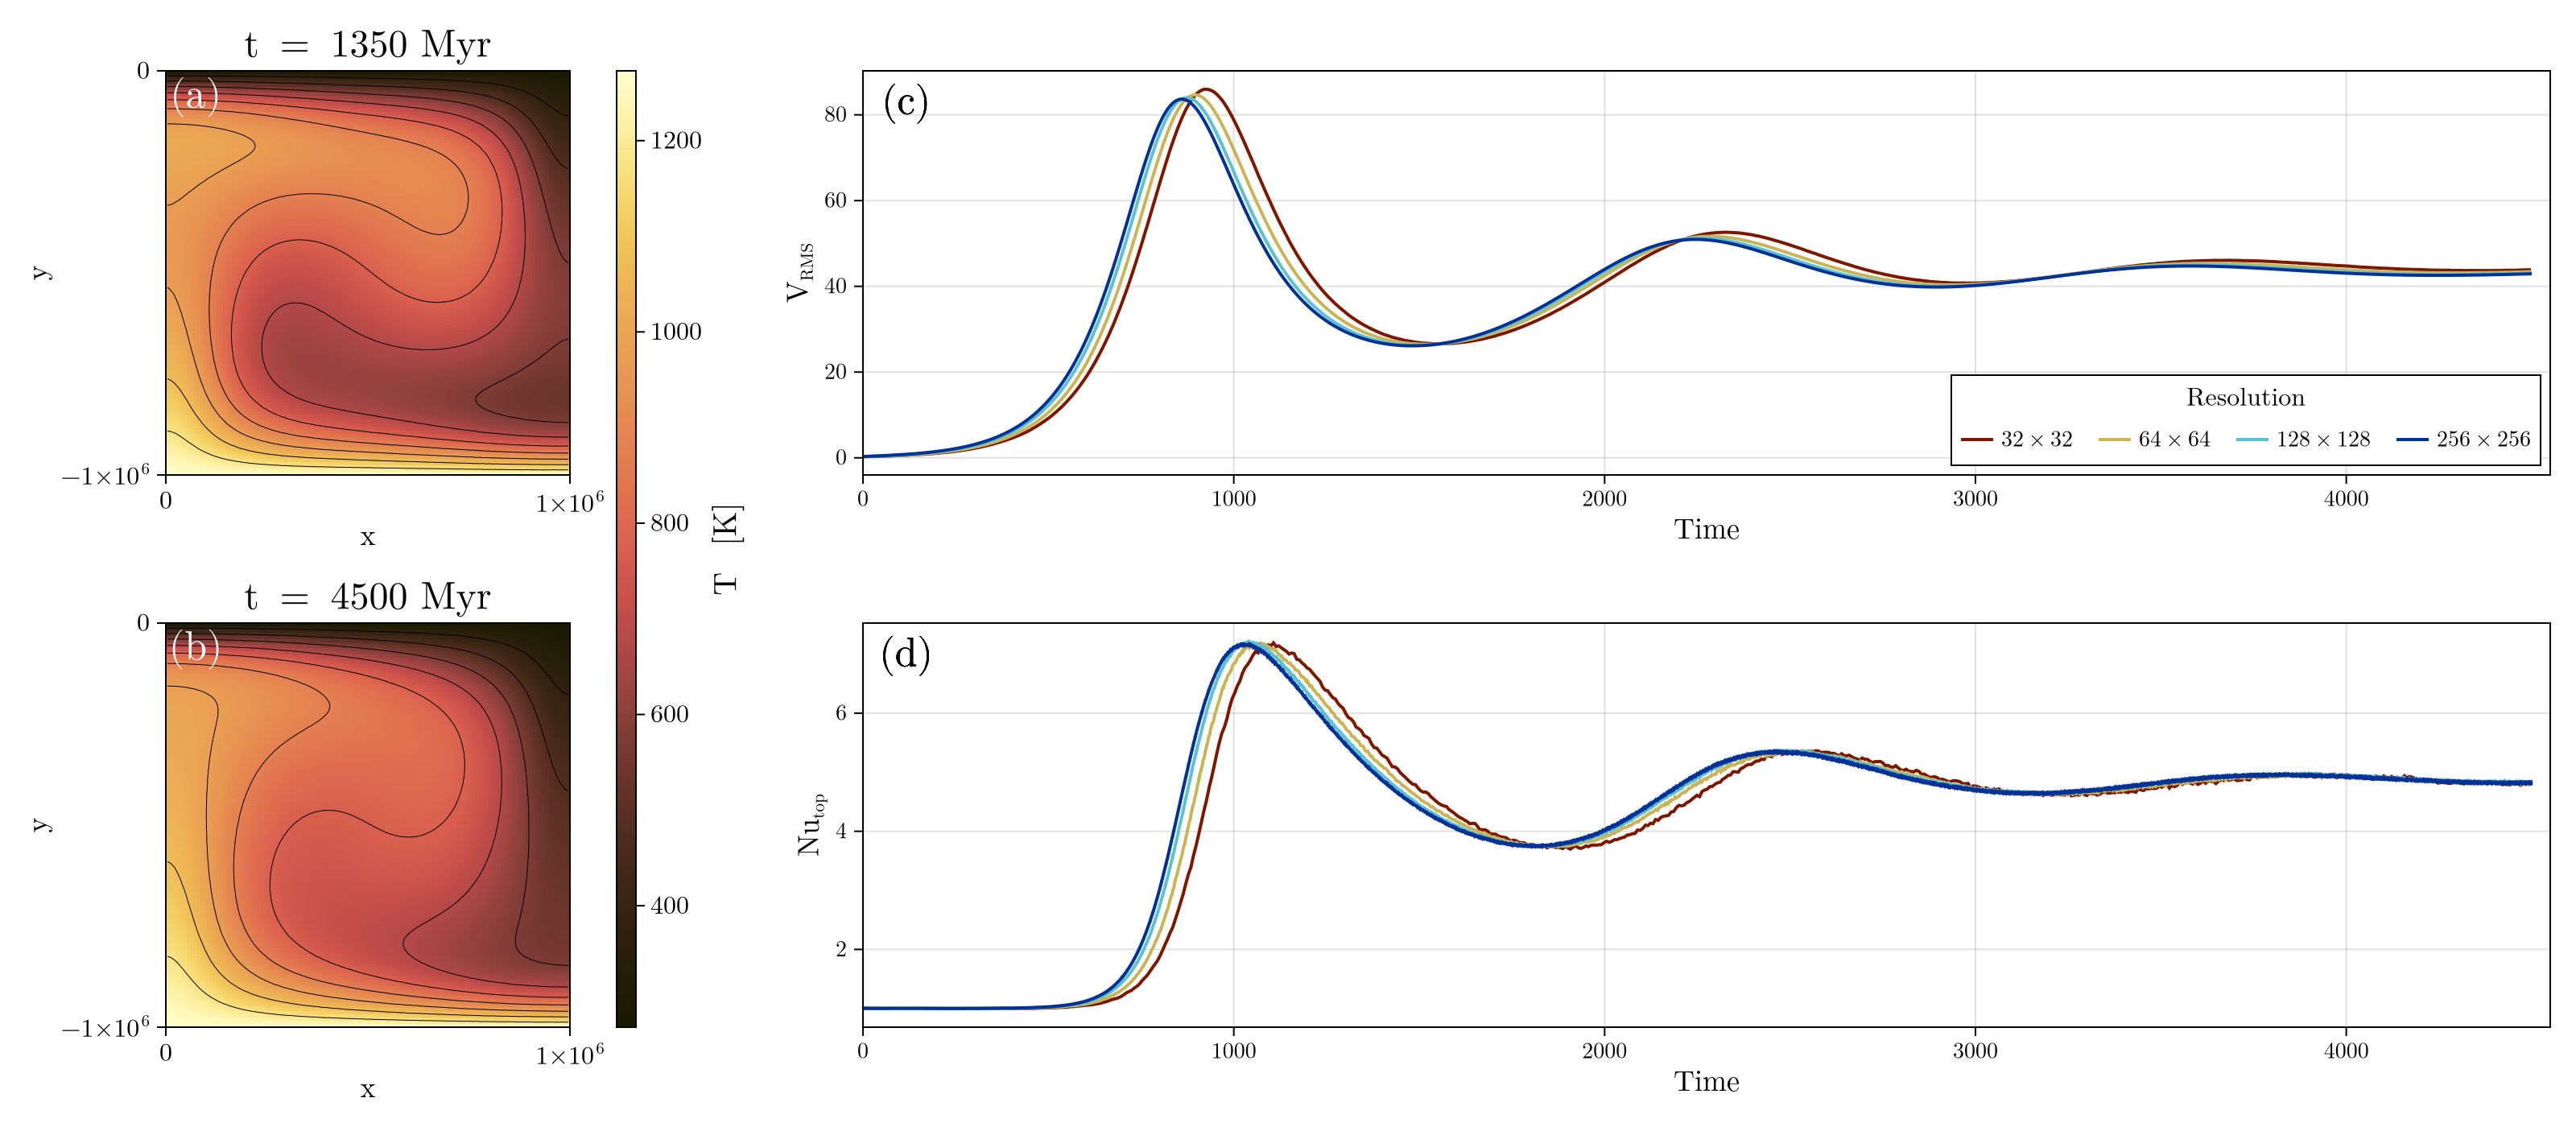
This resolution study compares the benchmark diagnostics across grid sizes.
This page was generated using Literate.jl.